Key insights on London’s divorce statistics
- The Ministry of Justice reports that the UK’s divorce applications decreased in the beginning of 2024, from January to March. 27,908 applications were submitted but only 21,662 final orders were granted under the new divorce law.
- The Office for National Statistics states that in 2022, there were 80,057 divorces in England and Wales. This was a significant decrease of 29.5% compared to 2021, and the lowest number since 1971.
- Studies from the Office for National Statistics show that women are more likely to file for divorce than men. In opposite-sex divorces, approximately 63% of the 71.7 divorces were sole petitions filed by females, and 37% by males. 28.3 divorces were submitted jointly.
Based on studies from The London Post, an estimated 10% of the UK’s divorce applications come from London.
The divorce rate, representing the number of divorces per 1,000 married individuals, serves as a crucial barometer for understanding these shifts in family dynamics. It offers valuable insights into the stresses and supports experienced by marital relationships within a society.
Divorce statistics in different London regions
Divorce rates in London vary depending on the area. Central London areas usually have higher rates than areas further from the center.
The Standard UK reveals that in 2023, some parts of London had much higher divorce rates. For example, in Southwark, about 10 out of every 100 people got divorced.
According to The London Post, some areas of London have much higher divorce rates than others. These areas with higher rates are:
- Islington (10%)
- Royal Borough of Kensington and Chelsea (10%)
- Hammersmith and Fulham (10%)
- Hackney (10%)
- Lewisham (9.9%)
- Lambeth (9.9%)
- Southwark (10.3%)
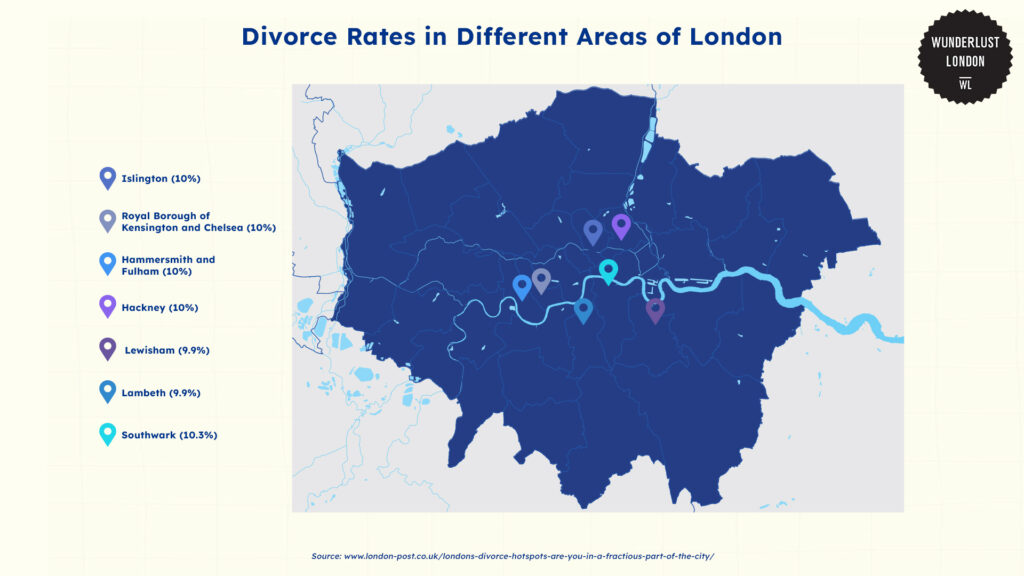
On the other hand, The London Post also reports that Harrow has the lowest divorce rate in London, with only 6% of marriages and civil partnerships ending in divorce. This is quite low compared to the average divorce rate across London, which is just under 10%.
Demographic breakdown of divorce statistics in London
Divorce rates in London by gender
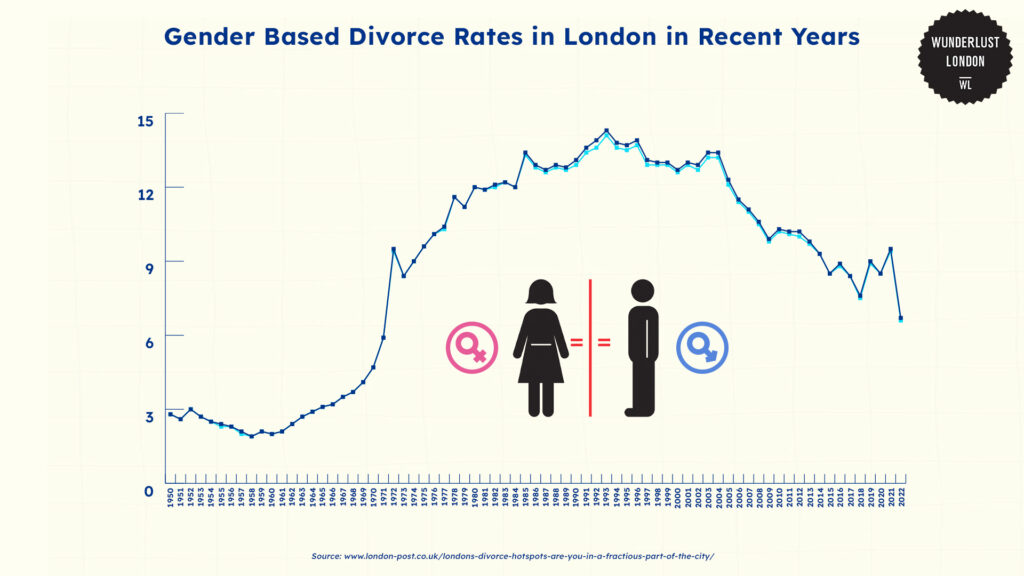
Office for National Statistics (ONS) states that in 2022, divorce rates for both men (6.7 per 1,000 married men) and women (6.6 per 1,000 married women) reached their lowest point since 1971, when the rate was 5.9 per 1,000 for both sexes.
The 2022 figures from ONS represent a decrease of 2.8% from the rates in 2021. This decline contrasts with an increase observed between 2020 and 2021.
However, divorce rate trends reported on ONS shows that from 2017 onwards were influenced by processing delays in 2017-2018 and the COVID-19 pandemic in 2020-2021. This could have affected the timing of divorce completions.
That said, statistics from the Ministry of Justice report that in 2024, the UK’s divorce applications decreased in January to March. 27,908 applications were submitted but only 21,662 final orders were granted under the new divorce law.
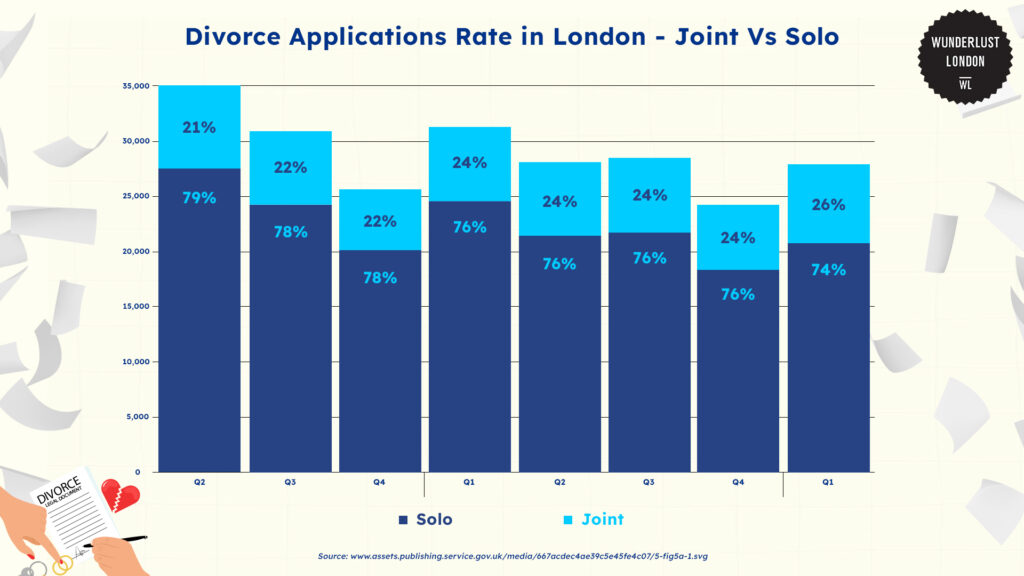
As displayed in the graph above, out of those applications in 2024, 74% were from sole applicants and 26% from joint applicants. The divorce rate approval in 2024 decreased when compared to the same time in 2023. In 2023, over 30,000 divorce applications were submitted.
Divorce rate statistics in London by years of marriage
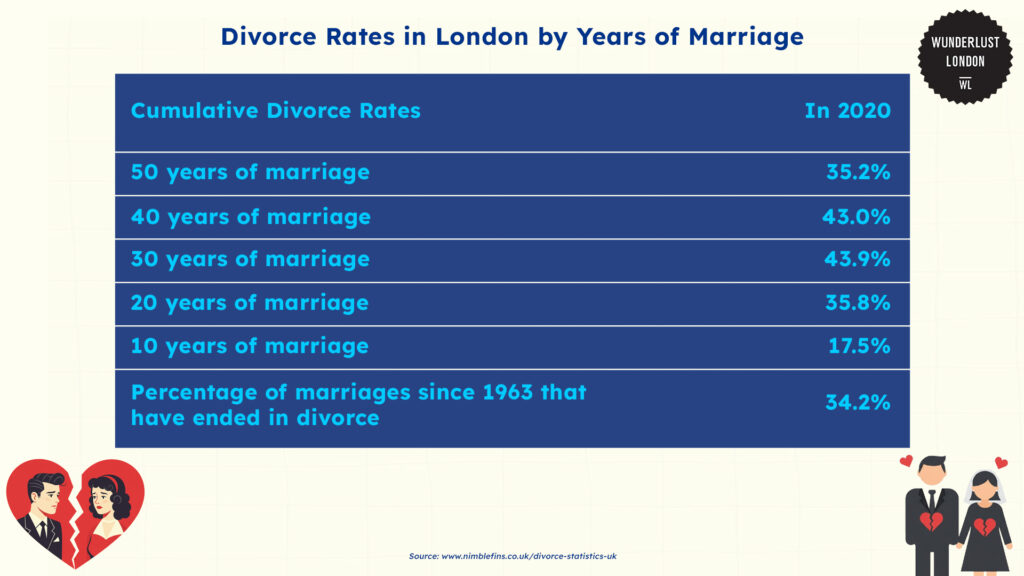
As seen in the table, divorce rates are influenced by both marriage duration and the year of the wedding.
For instance, statistics gathered by NimbleFins show that by 2022, 35.2% of couples married for 50 years (since 1972) had divorced. Overall, 43.0% of all marriages from 1972 had ended by 2022.
NimbleFins also reports that Among couples married in 2012, 17.5% divorced within the first ten years (by 2022), a decrease from the roughly 20% seen in previous periods, potentially indicating increased stability in newer marriages.
Divorce rate statistics by age in London
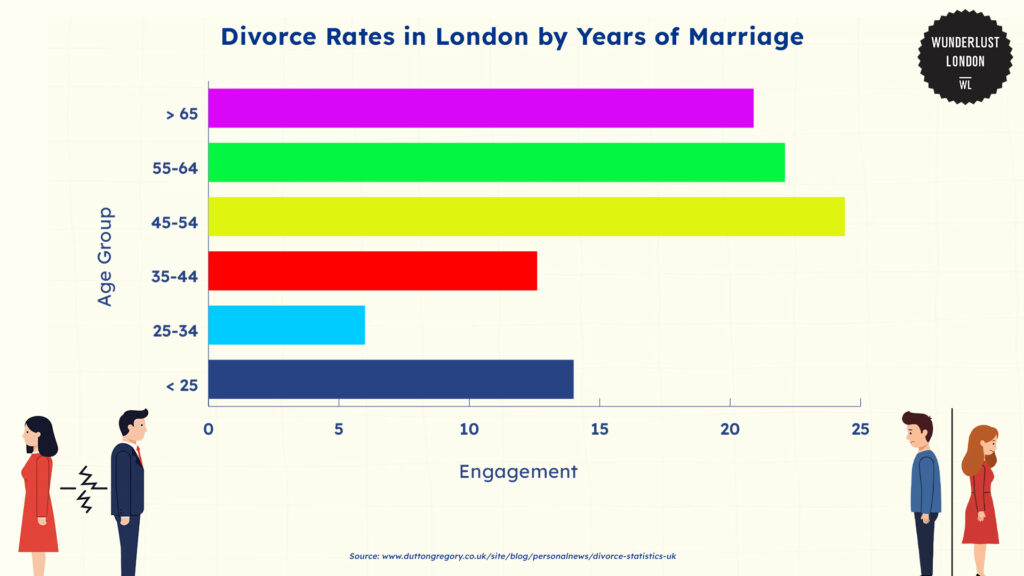
According to Dutton Gregory, in England and Wales (including London), divorce is most common for people between 45 and 54 years old.
As presented in the bar graph about 24% of people in this age group get divorced. 22.1% of people aged 55 to 64 and around 20.9 % of people over 65 file for divorce.
Divorce is less common for people under 35. Only 6% of people ages 25 to 34 get divorced, and 14% of couples under aged 25.
Divorce rates by partnership type in London
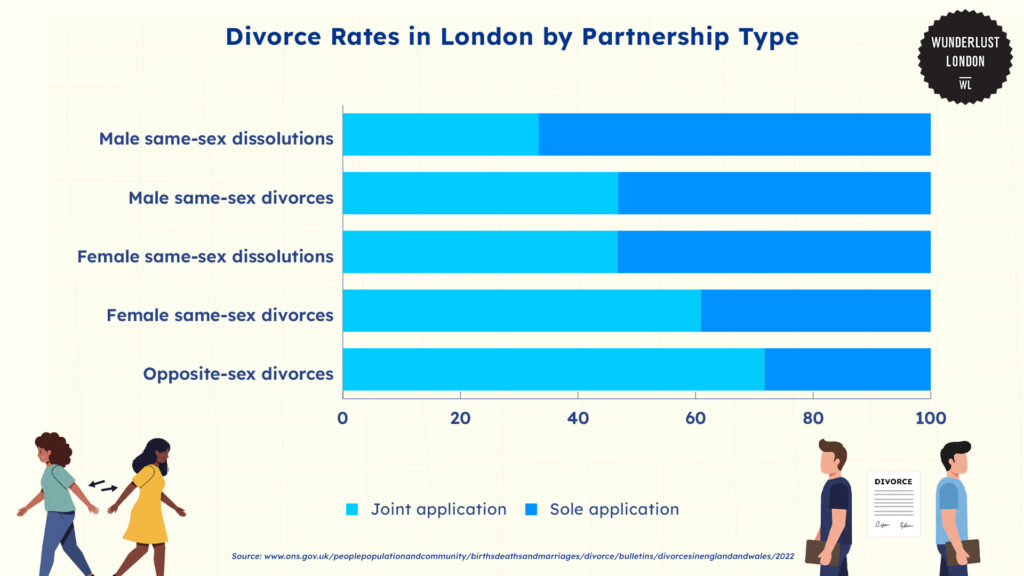
Studies from the Office for National Statistics show that women are more likely to file for divorce than men. In opposite-sex divorces, approximately 63% of the 71.7 divorces were sole petitions filed by females, and 37% by males. 28.3 divorces were submitted jointly.
Additionally, the Office for National Statistics reveals that in same sex marriages, for females, one partner solely applies approximately 60.9% of the time for a divorce—jointly its 39.1%.
Office for National Statistics also reports for male same sex divorces, the rates land on 46.8% for sole applications and 53.2% for joint applications.
Divorce trends in London over the past decade
Reports from Statista show that the divorce trend percentages fluctuated from 2010 to 2020.
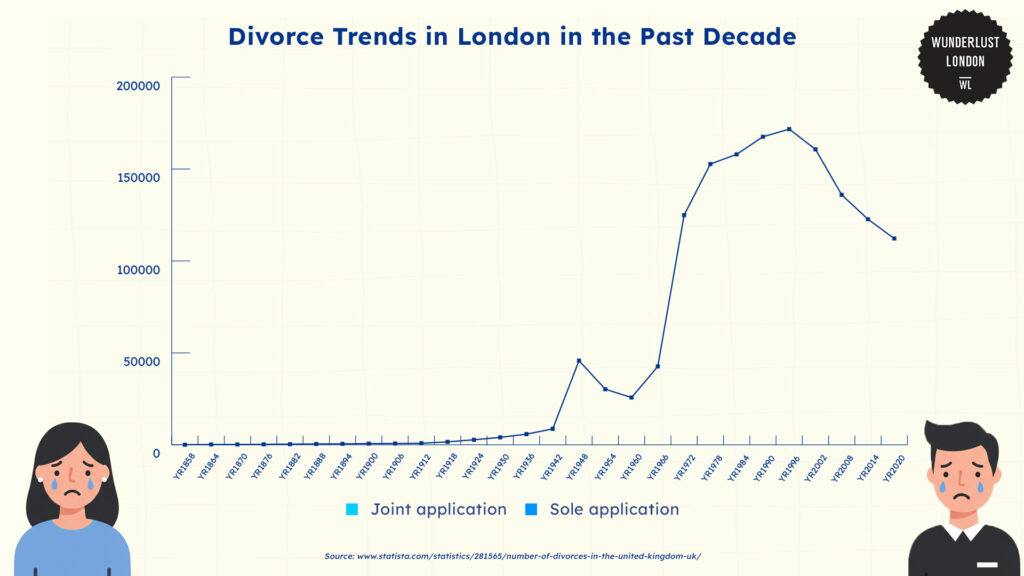
According to Statistica, after a slight increase from 118,140 divorces in 2012 to 130,473 in 2013, numbers generally decreased, reaching 101,127 in 2018 and 119,428 in 2019. In 2020, the number of divorces was 112,182.
But then in 2022, there were 80,057 divorces in England and Wales. The Office for National Statistics reports that this was a significant decrease of 29.5% compared to 2021, and the lowest number since 1971.
Contributing factors to divorce rates in London
Several factors contribute to divorce in London and across England and Wales, but unreasonable behavior is the most common.
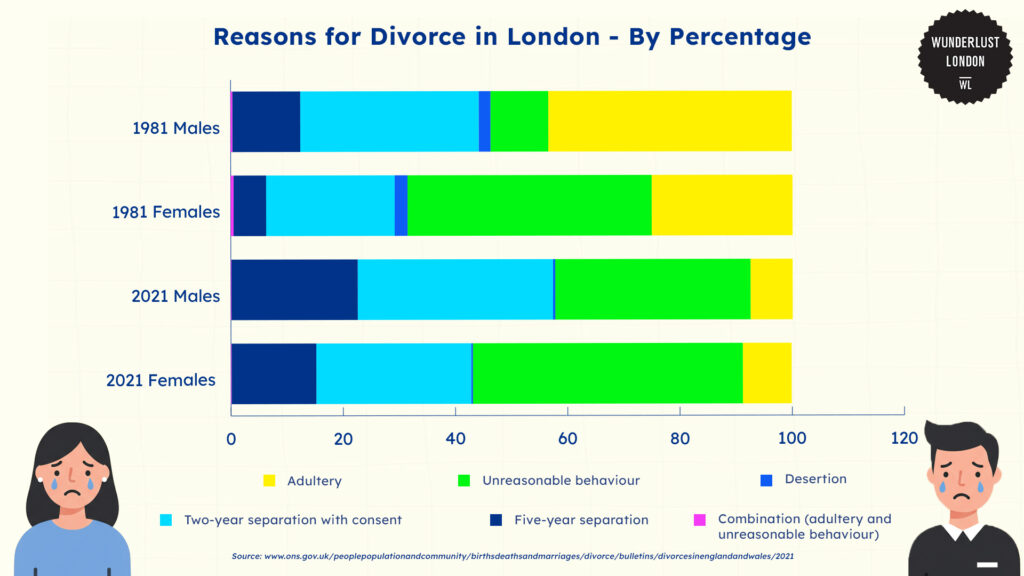
The Office for National Statistics reports that in 2021, 34.8% of males and 48.1% of females cited unreasonable behaviour as their main reason of divorce.
“Unreasonable behavior” encompasses a range of issues, including but not limited to:
- Emotional abuse
- Lack of communication
- Domestic abuse
- Substance abuse
- Workaholism
Other legal grounds for divorce in London
Besides unreasonable behavior, the Office for National Statistics reveal other legal grounds for divorce include:
- Two-year separation with consent: Couples who have lived separately for two years and mutually agree to divorce can cite this as grounds. Data reveals about 34.8% males in 2021 and 27.6% of females cited this as their reason.
- Five-year separation (no consent): If a couple has lived apart for five years, divorce can be granted even without the other spouse’s consent. About 22.5% of males and 15.1% of females in 2021 used this reason for their divorce.
- Adultery: Infidelity remains a legal ground for divorce. 7.5% of males and 8.7% of females in 2021 cited this as their reason.
- Desertion: If one spouse abandons the other for a continuous period of at least two years, this can be grounds for divorce, although it is rarely cited.
This is evidenced by the data studies in 2021, where only .3% of females and .4% of males said this was their reason for divorce.
The effects of the divorce law on London’s divorce rate statistics
London’s divorce laws have changed to make the process less confrontational and more modern. Reports from Dr Bernard Andonian states the biggest change is “no-fault divorce,” which focuses on being fair and reducing arguments when couples decide to separate.
After the No-fault divorce law passed, there was an decrease in divorce applications.
The Office for National Statistics states in England and Wales, the number of divorces reached a low in 2022, with 80,057 total divorces. This represents the lowest divorce rate since 1971 and a 29.5% decrease compared to the 113,505 divorces in 2021.
Similarly, dissolutions also decreased. In 2022, there were 525 dissolutions, marking a 22.8% decrease from the 680 dissolutions in 2021. The Office for National Statistics reveals that this is the lowest number of dissolutions since 2010.
However, continued research is needed to monitor divorce trends, understand the long-term effects of “no-fault divorce,” and further explore the multifaceted factors contributing to marital breakdown in London’s diverse population.
References
- Cobb, A. S. a. P. (2024, February 22). Divorces in England and Wales – Office for National Statistics. https://www.ons.gov.uk/peoplepopulationandcommunity/birthsdeathsandmarriages/divorce/bulletins/divorcesinenglandandwales/2022#divorce-rates
- Family Court statistics quarterly: January to March 2024. (2024, June 26). GOV.UK. https://www.gov.uk/government/statistics/family-court-statistics-quarterly-january-to-march-2024/family-court-statistics-quarterly-january-to-march-2024
- Statista. (2024, September 13). Number of divorces in the UK 1858-2020. https://www.statista.com/statistics/281565/number-of-divorces-in-the-united-kingdom-uk/
- Yurday, E. (2019, November 14). Divorce Statistics UK 2020. Nimblefins.co.uk; NimbleFins. https://www.nimblefins.co.uk/divorce-statistics-uk
- Divorce Statistics UK 2025: For Those Considering Divorce – Dutton Gregory Solicitors. (2025, February 10). Dutton Gregory. https://www.duttongregory.co.uk/site/blog/personalnews/divorce-statistics-uk
- Cobb, A. S. a. P. (2024b, February 22). Divorces in England and Wales – Office for National Statistics. https://www.ons.gov.uk/peoplepopulationandcommunity/birthsdeathsandmarriages/divorce/bulletins/divorcesinenglandandwales/2022
- Knibbs, J. (2023, February 24). London and UK’s divorce hotspots revealed according to new data. Evening Standard. https://www.standard.co.uk/news/uk/most-divorces-london-uk-census-data-b1062398.html
- Ldn-Post, & Ldn-Post. (2024, August 20). London’s Divorce Hotspots: Are You in a Fractious Part of the City? – London Post. London Post. https://london-post.co.uk/londons-divorce-hotspots-are-you-in-a-fractious-part-of-the-city/
- Cobb, A. S. a. P. (2022, November 2). Divorces in England and Wales – Office for National Statistics. https://www.ons.gov.uk/peoplepopulationandcommunity/birthsdeathsandmarriages/divorce/bulletins/divorcesinenglandandwales/2021
- Andonian, B. (2024, December 3). Recent changes in UK Divorce Law 2025. Gulbenkian Andonian Solicitors. https://www.gulbenkian.co.uk/recent-changes-in-uk-divorce-law/
- Ministry of Justice. (2022, April 5). “Blame game” ends as no-fault divorce comes into force. GOV.UK. https://www.gov.uk/government/news/blame-game-ends-as-no-fault-divorce-comes-into-force